The City of Fountains covers a whopping 319 square miles, which puts KCMO in the top 25 largest cities by land area in the country. (Not to mention, we also invest time in other areas of the greater region including Liberty, Prairie Village, KCK, Lee’s Summit, Belton and others.) With so much area to cover you may be wondering “How does HTA go about deciding which areas of town to work in?” “How do you balance all your partner organizations’ needs?” “How do you fairly distribute these trees?” …all questions that keep me up at night…
Over the past several years, Heartland Tree Alliance (HTA) has been building a process, and the necessary tools, to help us narrow down our focus areas within the city. Below I’ll walk you through several different data sources we use to help us select some of our target areas for tree plantings. This type of data-driven approach helps us craft narratives about WHY we are planting trees where we are. No neighborhood we select will meet every priority, but we try to select several that meet some of each different priority.

By Joe Wheelock. Joe is a Heartland Tree Alliance Program Manager.
Existing Tree Canopy
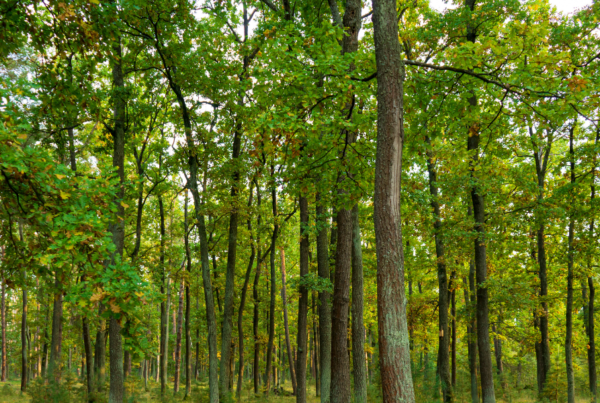
What is the urban forest? Urban forests encompass all trees and shrubs in an urban area. Including trees in yards, along streets and utility corridors, in parks and other protected areas, and along our rivers.
Did you know that KCMO has an Urban Forest Master Plan? The UFMP was adopted in 2020 by the city council. It outlines the value and services provided by trees in Kansas City, assesses the sustainability of Kansas City’s existing urban forest, and gives a vision and mission for the future urban forest. Included in the plan is a neighborhood-by-neighborhood analysis of existing tree canopy and the potential maximum tree canopy. KC’s urban forest provides $28 million in ecosystem services annually to the metro. Currently it’s estimated that KC has an urban tree cover of 31%. To meet our environmental goals, the UFMP sets a city-wide canopy target of 35%.
Public Health Outcomes
Most people are familiar with the environmental benefits of trees; they sequester carbon, provide us oxygen, and intercept stormwater, but did you know they are also an important public health tool? Poor air / water quality, heat-stressed environments, and limited activity result in public health concerns in cities across the US. Trees have been shown to impact all these metrics. Understanding which communities are burdened by poor public health outcomes can be useful in prioritizing projects. There are a variety of online mapping tools available to help.
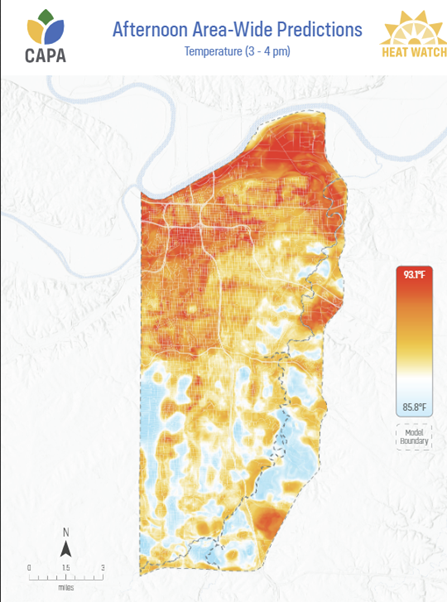
Urban Heat
Areas with lower tree canopy tend to be significantly hotter than areas with a higher tree canopy. Where available we look at data on the urban heat island. We recently partnered with Dr. Fengpeng Sun at UMKC to conduct a study of the urban core in KC. While it doesn’t cover the whole city, it can provide important context for why we may prioritize one area over another adjacent area.
Partner Priorities & Demographics
KCMO has identified a set of zip codes they are emphasizing – 64126, 64127, 64128, 64129, 64130, 64132 – through their community health improvement plan (CHIP). KCMO Parks emphasizes the same areas, however, you may see it referred to as the QLID or Quality of Life Improvement District. Additionally, we look at the Missouri Department of Conservation (MDC) priority conservation areas. This aligns closely with the QLID.
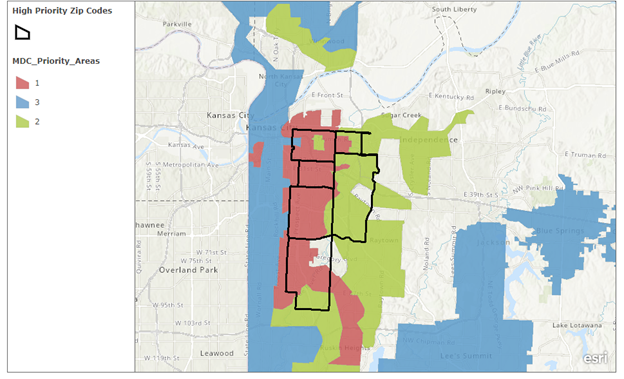
These six zip codes in KC have been disinvested in and, as a result, the life expectancies of those living in these areas are significantly lower than elsewhere. When areas have been disinvested in you also see lower tree canopy and higher heat. Inextricably linked is demographics. Due to a legacy of redlining policies, these areas are also overwhelmingly African American and brown communities. For more information on how the legacy of redlining and disinvestment have impacted neighborhood level tree canopy check out American Forest’s Tree Equity Score.
Neighborhood Assessment
Heartland Tree Alliance has created a neighborhood level assessment that examines conditions on the ground on a neighborhood-by-neighborhood basis. A walkthrough of each neighborhood is completed that examines several aspects of the built environment and helps to identify community partners and assets. Demographic, health, and environmental data is layered on top of our real world observations to help narrow our focus.
City Projects
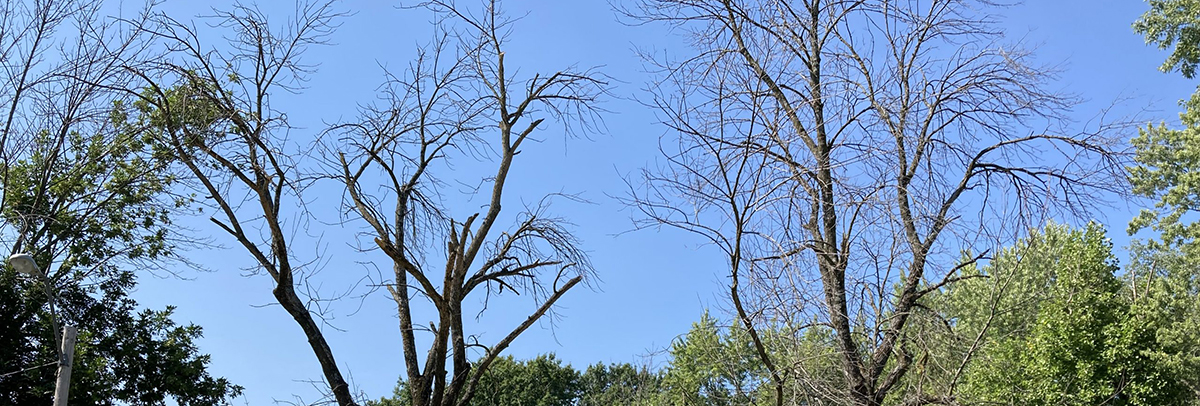
Trees are infrastructure. They cool our city, clean our air, beautify spaces, and create linkages between other assets. We look at where improvements are happening in neighborhoods and think about how we can compound benefits by being strategic in our plantings. If a neighborhood park is being improved, how can we create tree-lined streets that funnel you to the park? If sidewalks are being added or repaired, how can we make sure trees are included? If the existing canopy is largely Ash trees, how can we begin replanting before they are removed?

Community Buy-In
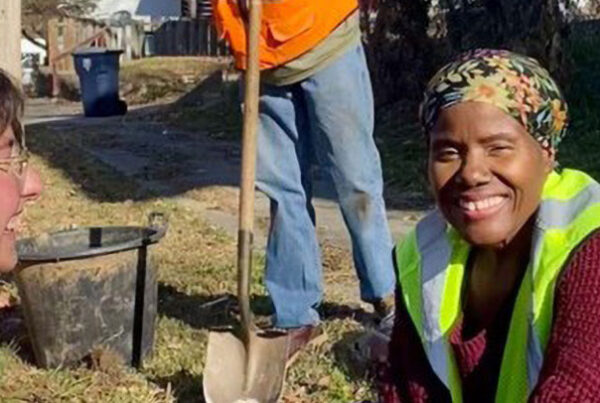
Last, but certainly not least, we take into consideration resident voices. We need your feedback! What do you love about your neighborhood’s trees? What issues do you experience? Where would YOU like to see more trees? Let us know! We’d love to take a walk through your neighborhood and hear from you 😊 We recognize this is a work in progress and welcome your feedback. Our email is always open. Reach us at trees@bridgingthegap.org or tell us more about the trees in your community by filling out this simple survey.

